Chart 1 – Credit card debt
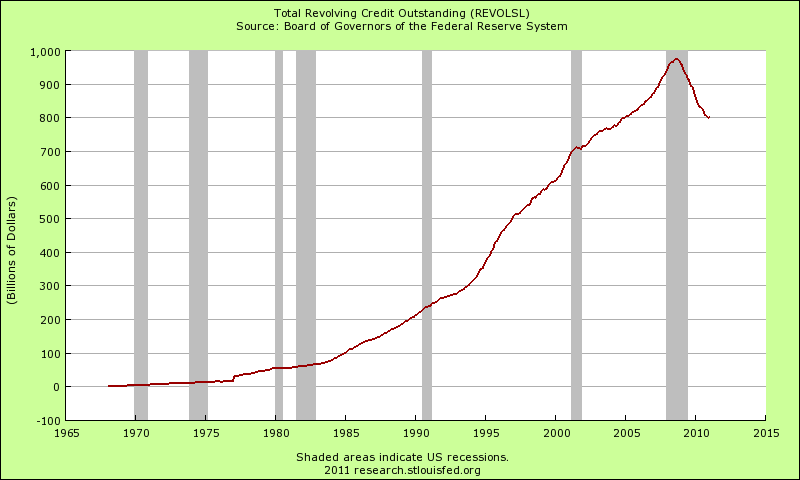
Everyone love credit cards right along with apple pie. Since the 1970s the amount of credit card debt in the United States moved unrelentingly higher and higher. By 2007 close to $1 trillion in credit card debt was outstanding. During the crazy debt era of securitization we were hearing stories of cats being issued credit cards with $5,000 limits. It was a massive debt bubble. Many average American families have relied on credit cards to give them the impression that they were keeping up with a middle class lifestyle but instead were simply borrowing time on expensive shiny plastic. With stagnant incomes over a decade the piper is now calling. The above chart clearly shows the contraction in outstanding credit card debt in the U.S. Much of this debt is being discharged in bankruptcy if you are wondering how the chart is moving lower so quickly.
Chart 2 – Growing financial sector versus manufacturing
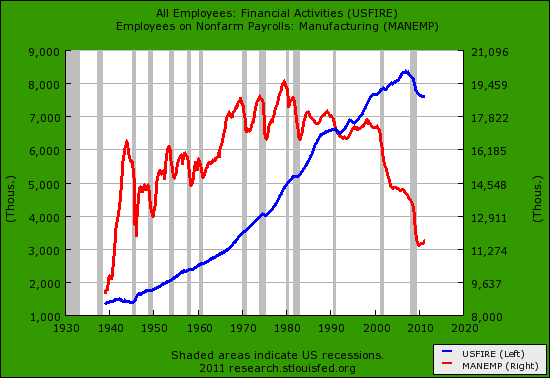
The above chart shows the financialization of the American economy. Since 1970s the U.S. manufacturing sector has contracted. Over 19 million workers were employed in manufacturing during the 1970s. Today we have slightly above 11 million workers with many more living in the country. Over 40 years later and our manufacturing workforce has been cut nearly in half. But look at the financial sector. This part of the economy has been adding jobs almost nonstop. It seems that the U.S. economy was largely built on debt production and collection; credit cards, mortgages, student loans, and auto debt. Someone needs to collect the interest right? Yet how useful is it to have giant parts of your economy developed to make nothing and suck away actual real wealth from the productive side of the market? That is what Wall Street investment banks have done for many decades and it coalesced with our current Great Recession.
Chart 3 – Excess Reserves
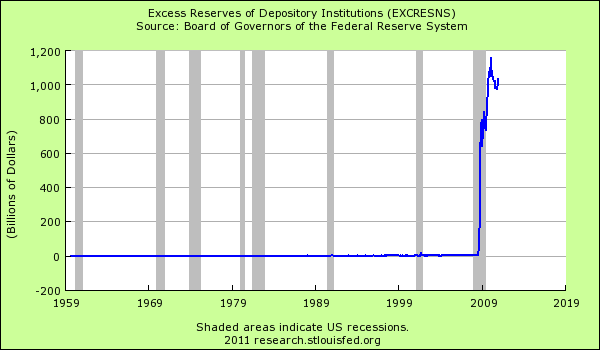
Where is all that easy money going from the Federal Reserve? Clearly it isn’t going toaverage Americans in credit cards. Much of the taxpayer bailouts are being held as excess reserves and banks currently have over $1 trillion that they can easily deploy into the economy helping the middle class. Why don’t they? They don’t trust the economy because they only need to look at their internal shady practices. They are holding onto this money for the coming problems that will hit with more defaults across all levels of loans. The bailouts were simply a way to save the banks. Make no mistake, banks do not trust the middle class that is largely responsible for bailing them out.
Chart 4 – Too big to fail banks
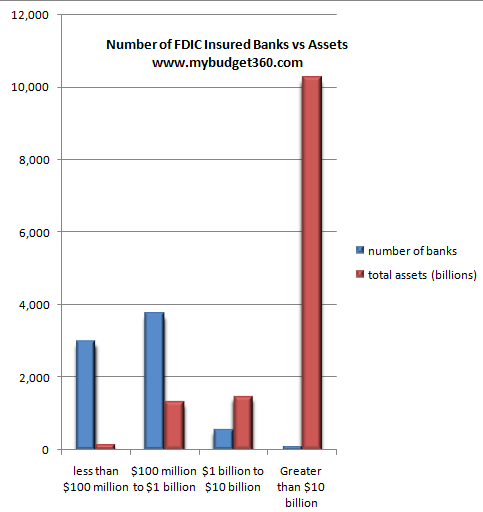
The too big to fail have gotten even bigger in the latest crisis. Over $10 trillion of all banking assets sit with a handful of the over 7,500 FDIC insured banks in the United States. Instead of using the crisis to make the too big to fail smaller the government in conjunction with Wall Street has made the big banks even bigger with more taxpayer protection. This has done little in making the financial lives of Americans any better. Most of these banks are now making a large portion of their profits via overseas investments and stock market speculation (all on your dime by the way). Little has been done to shore up the finances of the middle class here and many of these banks charge high interest and other hidden costs to scam Americans.
Chart 5 – Federal debt projections
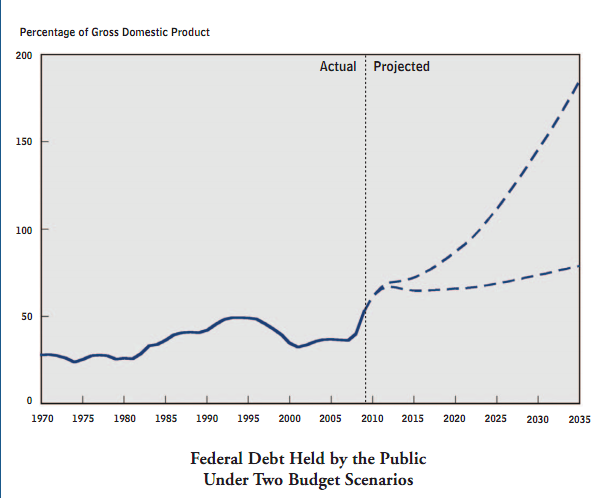
Source: CBO
The above chart shows that we have no intention of paying back our Federal debt. The optimistic scenario would require massive spending cuts that would likely contract the economy. The more dire line is basically us going on the same path. We are on this path. Nothing dramatic has changed in the last few years. If we were adding jobs to the productive sector of the economy then we would have a better chance but instead the banking sector has sucked away all the taxpayer resources. There are giant expenses like Medicare that will eat a hole in our budget for years to come. It is likely that we will face cuts and tax hikes in the next decade which doesn’t add any support for the middle class.
Chart 6 – Top 1 percent
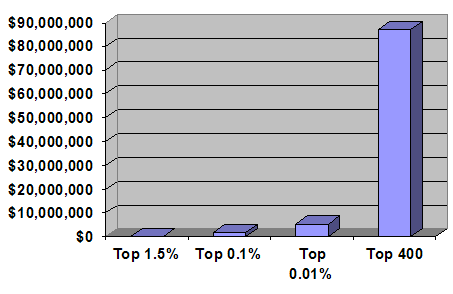
Wealth inequality in the U.S. is at levels not seen since the 1920s. We all know what happened after that. In fact since the 1970s the top 1 percent have managed to control and take over 42 percent of all financial wealth in the United States. We have seen in various reports that many top companies through various tax loopholes pay zero or close to it in taxes while most Americans have to pay Social Security and other taxes on a daily basis. Real wealth gains have come for the top 10 percent while 90 percent of American household have gone into debt merely to stay on a middle class path. We are witnessing the effects of an economy that favors the entrenched plutocracy.
Chart 7 – Government spending
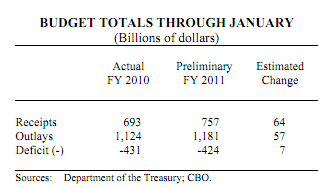
Just look at the above from the latest CBO report. We keep spending more than we earn as a nation. In the 2010 fiscal year we brought in $693 billion yet spent $1.1 trillion. This year it is expected to bring in $757 billion while spending $1.1 trillion again. How is this sustainable? It isn’t. The only reason we can do this is because the Federal Reserve can print away and devalue the U.S. dollar globally. On a more basic level this means the quality of life of Americans will go lower and lower. Notice how food prices are soaring? Notice how gas is $4 a gallon? Notice how college costs are soaring? The dollar isn’t going as far as it once did and this isn’t by accident. Yet bank profits are soaring and those that run these institutions keep getting more and more wealth in the top 1 percent bracket.
Chart 8 – Where do Americans work
Source: Wikipedia
What should stand out above is how few physical people work in finance but the share of their profits relative to all total sales and revenues is enormous. No other field has this kind of lopsided data. Wall Street banks continues to rob the public blind by devaluing the U.S. dollar through their shell organization in the Federal Reserve. These are institutions that are largely responsible for the Great Recession with their creation of the toxic junk financial instruments and other archaic system designed to surgically suck true wealth out of the economy and aggregate it into the hands of the few. What many are realizing is that we are in for a challenging decade ahead. Even with jobs being added these are happening in lower paying sectors. This is the last thing we need with half of Americans working at jobs making $25,000 a year or less. Unless things radically change the middle class will be gone within one decade.
No comments:
Post a Comment