How do you want to receive change?
11 May 2013
10 May 2013
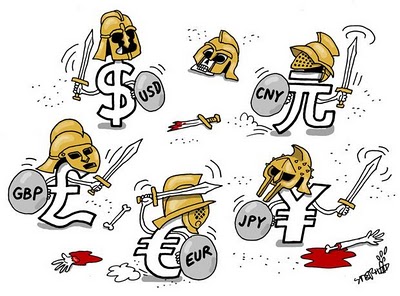
Welcome to the Currency War, Part 8: US Issues Variable-Rate Debt
 It’s easy to understand the attraction of things like adjustable-rate mortgages and teaser-rate credit cards. They give you cheap money up front and a few years of breathing room in which to raise your cash flow to cover the eventual higher payments.
Sometimes this works out for the best. But frequently not. If your cash flow doesn’t rise, a big jump in interest expense can ruin your life, as millions of American homeowners discovered when the mortgage bubble burst in 2007.
But the appeal of variable-rate debt endures. Now, amazingly, it’s the US government’s turn:
The U.S. Treasury Department said it plans to sell a floating-rate security as early as the fourth quarter this year and signaled it may decide to “gradually” reduce the supply of notes and bonds at auction.In its quarterly refunding statement today, the Treasury said a final rule on the floating-rate note auction is planned for coming months, with a first sale estimated to occur either in the fourth quarter this year or the first quarter of 2014. The department said it will use the weekly high rate of 13-week Treasury bill auctions as the index for the notes.With a budget deficit of more than $1 trillion last year, the Treasury needs to expand its base of investors. So-called floaters may appeal to those who are seeking to protect themselves from a possible increase in interest rates or faster inflation stemming from the Federal Reserve’s unprecedented monetary stimulus.“The floaters are being tailored to its audience and also to make it easier to transition into the product,” George Goncalves, head of interest-rate strategy in New York at primary dealer Nomura Holdings Inc., said in a telephone interview.New OfferingThe floating-rate notes would be the first added U.S. government debt security since the Treasury Inflation-Protected Securities, known as TIPS, were introduced in 1997.“Indexing to the bill rate is likely a function of a preference at the Treasury and because global investors, like central banks, are more familiar buying Treasury bills and are likely more comfortable with this approach to the floaters,” Goncalves said.The minutes said that James Clark, deputy assistant secretary for federal finance, told the panel that the Treasury was tentatively considering $10 billion to $15 billion in floaters a month and would solicit more market opinions as the first auction approached.
Some thoughts
Just when you think we can’t get any dumber, along comes the next beginner’s mistake, committed by supposedly the smartest people the world’s most powerful government can attract.
Just when you think we can’t get any dumber, along comes the next beginner’s mistake, committed by supposedly the smartest people the world’s most powerful government can attract.
As the article notes, variable-rate bonds offer buyers some protection against rising interest rates. But of course the other side of that coin is that it increases the risk from rising interest rates for the rest of us. Already, the federal debt is mostly short-term paper that has to be rolled over every year or two. So rising interest rates would send the Treasury’s debt service costs through the roof as each new rollover is at a higher rate. Issuing longer-term floating-rate bonds would simply streamline the translation of higher rates into higher interest costs. In that sense, the new strategy is like maxing out teaser-rate credit cards to pay off a mortgage; good for cash flow in year one, very bad thereafter.
This is not an issue while the Fed is buying up $85 billion of Treasuries each month and rebating the resulting interest to the Treasury. It’s when the Fed tries to stop that things get dicey. Because a robustly-growing economy – which is the goal of all this borrowing and spending – naturally leads to higher interest rates. During the good old days of 1960 – 1980, the average rate on government borrowing was about 6%, or more than twice as high as today.
But rising rates would send the interest the government owes to non-Fed bondholders through the roof, increasing the deficit and either crowding out productive spending – which would tend to slow economic growth – or creating an even bigger mountain of debt that will require low interest rates to pay off. A 6% average borrowing cost applied to the $20 trillion that Washington will owe in another few years yields an interest expense of $1.2 trillion – every year forever, much of it going to China, Japan, and Saudi Arabia.
To sum up, floating-rate government bonds are just one more reason that interest rates can never be allowed to rise (and QE can never stop), even if it means sacrificing the value of the dollar, yen and euro. Devaluation is the only way out – for everyone.
Source
Source
The Truth About The Gold Being Drained From GLD
It's really quite astonishing. Especially the degree to which the negative media reports - especially from Bloomberg News and CNBC - are piling up like dead bodies in the aftermath of the Mt. Vesuvius eruption.
I want to "connect some dots" for everyone who has been worried about the rather large liquidation of gold from GLD. In fact, media citations of this gold drain have proliferated like the odor of burning marijuana in the streets of Denver now that pot has been legalized (trust me, it's everywhere).
But what is really going on? Let's look "under the hood" at some relevant information that is being left out of a lot of the financial reporting in the U.S. To begin with, the way gold is put into or taken out of GLD is via the Authorized Participants. These are the primary market makers in GLD shares. When they collect a basket of 100,000 shares from buyers or sellers, they take the cash proceeds and either buy gold to move into GLD or buy gold from GLD to remove the gold from the trust. The current list of AP's, at least according to GLD's latest 10-K filing are: Barclays, Citigroup, Credit Suisse, Deutsche Bank, Goldman Sach, HSBC, JP Morgan, Merrill Lynch, Morgan Stanley, Newedge (a online hedge fund oriented futures bookie), RBC, UBS, and Virtu Financial (another online hedge fund bookmaker).
If the price of gold - for whatever reason, legitimate or not - gets crushed, it will tend to generate a lot of selling in the shares of GLD. In turn, that will generate the ability of the AP's to collect 100,000 share baskets and convert those baskets into gold that is removed from the GLD vault and into the "custody" of the specific AP who is turning in the shares. At today's price of gold, 100,000 shares represents about $14.2 million - 9,627 ozs of gold, or roughly .29 tonnes. Since the beginning of the year, roughly 293 tonnes of gold has been drained from GLD, which had 1350 tonnes in it - allegedly - on 12/31/12. Nearly 30% of the total amount of gold that has been drained from GLD occurred in the 3 weeks since the April 16-17 price massacre.
So where, you might ask, is all this gold going? It's not just vaporizing into thin air. Using today's price of gold, 293 tonnes is worth about $14.5 billion. If you look at that AP list above, all of them except the two hedge fund bookies are LBMA "bullion bank" market makers. Unless these bullion banks are keeping the gold for themselves - and if any of them were, it would have to show up in the footnotes of their next 10-Q - that gold is being delivered to buyers of it on the other side.
So, who would be buying this gold? Based on numerous news service reports, which often seem to never make their way into the U.S. financial media reporting, India and China combined through the end of April have imported somewhere around 700 tonnes of gold, plus or minus 100 tonnes. What's 100 tonnes among bullion bank friends when GLD still has 1,057 tonnes left? Here's one news report - actually from Bloomberg - which is calculating that China purchased around 223 tonnes of gold in March alone: LINK That is a staggering amount of gold (mostly 400 oz bars - the type of bar in GLD's vaults) when you consider that the global annual mined production of gold is around 2500 tonnes, and declining.
And here's an account out of India about the massive gold demand there in April and May:
This rabid demand for 400 oz. gold bars from China/India (not to mention Russia, Turkey, Viet Nam, pretty much all of southeast Asia) goes a long way toward explaining the rumors that were circulating during February and intensified in March that the LBMA was in danger of facing a big delivery default.
Layer on top of this the fact that many wealthy families in Europe are now demanding delivery of the gold bars that JPM and other bullion banks are holding custody of. The report on this from my friend was confirmed independently by a source of Bill Murphy's over in Europe. This is exactly why ABN/Amro announced a week before the $200 hit on gold that they would no longer deliver physical gold from their gold investment account product and would instead only settle redemptions in cash. That product catered to high net worth investors over there. ABN didn't have the gold that would be required to satisfy delivery claims. It was a fractional bullion investment account, just like all the other big bank "bullion" investment products. Morgan Stanley settled a lawsuit several years ago for this type of scheme using silver. But they never admitted guilt.
So in connecting all the dots, there is no question in my mind that the big price smashing of gold in mid-April was an operation designed to shake loose enough 400 oz. gold bars out of GLD in order to satisfy the enormous delivery demands coming from Asia, India and even within Europe. GLD is the only possible source of above-ground 400 oz. gold bars that could be used to satisfy this enormous demand for physically deliverable bars.
At some point, and probably sooner than most people are willing to believe, this physical demand is going to force an upward "explosion" of the paper derivatives being used to hold down the spot price right now. In 30 years of studying and trading the financial markets, I have never seen contrarian indicators for any market sector flashing as bullishly as they are for gold and silver, which further confirms my view that the metals have bottomed and are getting ready to give those of us who held on the ride of a lifetime.
Source
I want to "connect some dots" for everyone who has been worried about the rather large liquidation of gold from GLD. In fact, media citations of this gold drain have proliferated like the odor of burning marijuana in the streets of Denver now that pot has been legalized (trust me, it's everywhere).
But what is really going on? Let's look "under the hood" at some relevant information that is being left out of a lot of the financial reporting in the U.S. To begin with, the way gold is put into or taken out of GLD is via the Authorized Participants. These are the primary market makers in GLD shares. When they collect a basket of 100,000 shares from buyers or sellers, they take the cash proceeds and either buy gold to move into GLD or buy gold from GLD to remove the gold from the trust. The current list of AP's, at least according to GLD's latest 10-K filing are: Barclays, Citigroup, Credit Suisse, Deutsche Bank, Goldman Sach, HSBC, JP Morgan, Merrill Lynch, Morgan Stanley, Newedge (a online hedge fund oriented futures bookie), RBC, UBS, and Virtu Financial (another online hedge fund bookmaker).
If the price of gold - for whatever reason, legitimate or not - gets crushed, it will tend to generate a lot of selling in the shares of GLD. In turn, that will generate the ability of the AP's to collect 100,000 share baskets and convert those baskets into gold that is removed from the GLD vault and into the "custody" of the specific AP who is turning in the shares. At today's price of gold, 100,000 shares represents about $14.2 million - 9,627 ozs of gold, or roughly .29 tonnes. Since the beginning of the year, roughly 293 tonnes of gold has been drained from GLD, which had 1350 tonnes in it - allegedly - on 12/31/12. Nearly 30% of the total amount of gold that has been drained from GLD occurred in the 3 weeks since the April 16-17 price massacre.
So where, you might ask, is all this gold going? It's not just vaporizing into thin air. Using today's price of gold, 293 tonnes is worth about $14.5 billion. If you look at that AP list above, all of them except the two hedge fund bookies are LBMA "bullion bank" market makers. Unless these bullion banks are keeping the gold for themselves - and if any of them were, it would have to show up in the footnotes of their next 10-Q - that gold is being delivered to buyers of it on the other side.
So, who would be buying this gold? Based on numerous news service reports, which often seem to never make their way into the U.S. financial media reporting, India and China combined through the end of April have imported somewhere around 700 tonnes of gold, plus or minus 100 tonnes. What's 100 tonnes among bullion bank friends when GLD still has 1,057 tonnes left? Here's one news report - actually from Bloomberg - which is calculating that China purchased around 223 tonnes of gold in March alone: LINK That is a staggering amount of gold (mostly 400 oz bars - the type of bar in GLD's vaults) when you consider that the global annual mined production of gold is around 2500 tonnes, and declining.
And here's an account out of India about the massive gold demand there in April and May:
“The biggest slump in gold prices in more than three decades on April 15 spurred banks, traders and jewelers to import more than 100 tons last month, said Rajesh Khosla, managing director of MMTC-PAMP India Pvt. Purchases this month will match April’s imports, he said”And here's a refreshingly honest assessment of the situation from an Indian newspaper:
The jump in Chinese physical demand also prompted some banks to ship in more supplies from London and Swiss vaults, traders said LINKIf you read that entire article, you'll see that in 2012, India/China imported more than 1/3 of the global gold production and will likely account for close to 50% this year. This is the unintended consequences for the Central Banks who are spear-heading the manipulation of the price of gold for the purposes of defending the dollar and fiat currencies.
This rabid demand for 400 oz. gold bars from China/India (not to mention Russia, Turkey, Viet Nam, pretty much all of southeast Asia) goes a long way toward explaining the rumors that were circulating during February and intensified in March that the LBMA was in danger of facing a big delivery default.
Layer on top of this the fact that many wealthy families in Europe are now demanding delivery of the gold bars that JPM and other bullion banks are holding custody of. The report on this from my friend was confirmed independently by a source of Bill Murphy's over in Europe. This is exactly why ABN/Amro announced a week before the $200 hit on gold that they would no longer deliver physical gold from their gold investment account product and would instead only settle redemptions in cash. That product catered to high net worth investors over there. ABN didn't have the gold that would be required to satisfy delivery claims. It was a fractional bullion investment account, just like all the other big bank "bullion" investment products. Morgan Stanley settled a lawsuit several years ago for this type of scheme using silver. But they never admitted guilt.
So in connecting all the dots, there is no question in my mind that the big price smashing of gold in mid-April was an operation designed to shake loose enough 400 oz. gold bars out of GLD in order to satisfy the enormous delivery demands coming from Asia, India and even within Europe. GLD is the only possible source of above-ground 400 oz. gold bars that could be used to satisfy this enormous demand for physically deliverable bars.
At some point, and probably sooner than most people are willing to believe, this physical demand is going to force an upward "explosion" of the paper derivatives being used to hold down the spot price right now. In 30 years of studying and trading the financial markets, I have never seen contrarian indicators for any market sector flashing as bullishly as they are for gold and silver, which further confirms my view that the metals have bottomed and are getting ready to give those of us who held on the ride of a lifetime.
Source
9 May 2013

The Price Of Copper And 11 Other Recession Indicators That Are Flashing Red
 There are a dozen significant economic indicators that are warning that the U.S. economy is heading into a recession. The Dow may have soared past the 15,000 mark, but the economic fundamentals are telling an entirely different story. If historical patterns hold up, the economy is heading for a very rocky stretch.
For example, the price of copper is called "Dr. Copper" by many economists because it so accurately forecasts the future direction of the U.S. economy. And so far this year the price of copper is way down. But that is not the only indicator that is worrying economists. Home renovation spending has fallen dramatically, retail spending is crashing in a way not seen since the last recession, manufacturing activity and consumer confidence are both declining, and troubling economic data continues to come pouring out of Asia and Europe.
So why do U.S. stocks continue to skyrocket? Will U.S. financial markets be able to continue to be divorced from reality? Unfortunately, as we have seen so many times in the past, when stocks do catch up with reality they tend to do so very rapidly. So you better put on your seatbelts because a crash is coming at some point.
But most average Americans are not that concerned with the performance of the stock market. They just want to be able to go to work, pay the bills and provide for their families. During the last recession, millions of Americans lost their jobs and millions of Americans lost their homes. If we have another major recession, that will happen again. Sadly, it appears that another major recession is quickly approaching.
The following are 12 recession indicators that are flashing red...
#1 The price of copper has traditionally been one of the very best indicators of the future performance of the U.S. economy. The fact that it is down nearly 20 percent so far this year has many analysts extremely concerned...
Copper's downward trend foreshadows a stock market collapse, according to Societe Generale's famously bearish strategist Albert Edwards, who said equity markets will riot "Japan-style.""Copper is acting exactly as it did when I wrote about the impotence of liquidity in the face of the (then imminent) 2007 recession. Once again it is giving us an early warning that liquidity will not save risk assets: time to get out of equities," Edwards wrote in his latest research note, on Thursday.
#2 Home renovation spending has fallen back to depressingly-low 2010 levels.
#3 As Zero Hedge recently pointed out, U.S. retail spending is repeating a pattern that we have not seen since the last recession...
Retail sales of clothing is growing at the slowest pace since 2010; but while major store sales are about to drop negative YoY for the first time in over 3 years, the utter collapse in general merchandise sales is worse that at the peak of the last recession at -5%. It seems tough to see how a nation with an economy built on 70% consumption is not in a recessionary environment. And while this alone is a dismal signal for the discretionary upside of the US economy/consumer; as Gluskin Sheff's David Rosenberg points out real personal income net of transfer receipts plunged at a stunning 5.8% annual rate in Q1. The other seven times we have seen such a collapse, the economy was either in recession of just coming out of one.
#4 Manufacturing activity all over the country is showing signs of slowing down. In fact, Chicago PMI has dipped below 50 (indicating contraction) for the first time since the last recession.
#5 In April, consumer confidence unexpectedly fell to a nine-month low...
The Thomson Reuters/University of Michigan preliminary index of consumer sentiment declined to 72.3 in April from 78.6 a month earlier. This month’s reading was lower than all 69 estimates in a Bloomberg survey that called for no change from the March number.
#6 NYSE margin debt peaked right before the recession that began in 2002, it peaked right before the financial crisis of 2008, and it is peaking again.
#7 The S&P 500 usually mirrors the performance of Chinese stocks very closely. That is why it is so alarming that Chinese stocks peaked months ago. Will the S&P 500 soon follow?
#8 The economic data coming out of the Chinese economy lately has been mostly terrible...
#000000;">For starters, China’s recent economic data, as massaged as it is to the upside, is downright awful. China’s PMI numbers were the worst in two years. Staffing levels in the Chinese service sector decreased for the first time since January 2009 (remember that year).#000000;">China’s LEI also shows no sign of recovery. If anything, it indicates China is heading towards an economic slowdown on par with that of 2008. And if you account for the rampant debt fueling China’s economy you could easily argue that China is posting 0% GDP growth today.
#9 Things just continue to get even worse over in Europe. Unemployment in both Greece and Spain is now about 27 percent, and the unemployment rate in the eurozone as a whole has just set a brand new all-time record high.
#10 Crude inventories have soared to a record high as demand for energy continues to decline. As I have written about previously, this is a clear sign that economic activity is slowing down.
#11 Casino spending is usually a strong indicator of the overall health of the U.S. economy. That is why it is so noteworthy that casino spending is now back to levels that we have not seen since the last recession.
#12 The impact of the sequester cuts is starting to kick in. According to the Congressional Budget Office, the sequester cuts will cost the U.S. economy about 750,000 jobs this year.
Subscribe to:
Comments (Atom)